Entresto’s lifecycle asks a harder question: where should the field team go next?
Recent generic-pressure reporting anchors a fictional sales-force redeployment and productivity model.
ClarusBIOTECH REVIEWRead, listen & keep
Narrated by Hermione. Save the audio for offline listening.
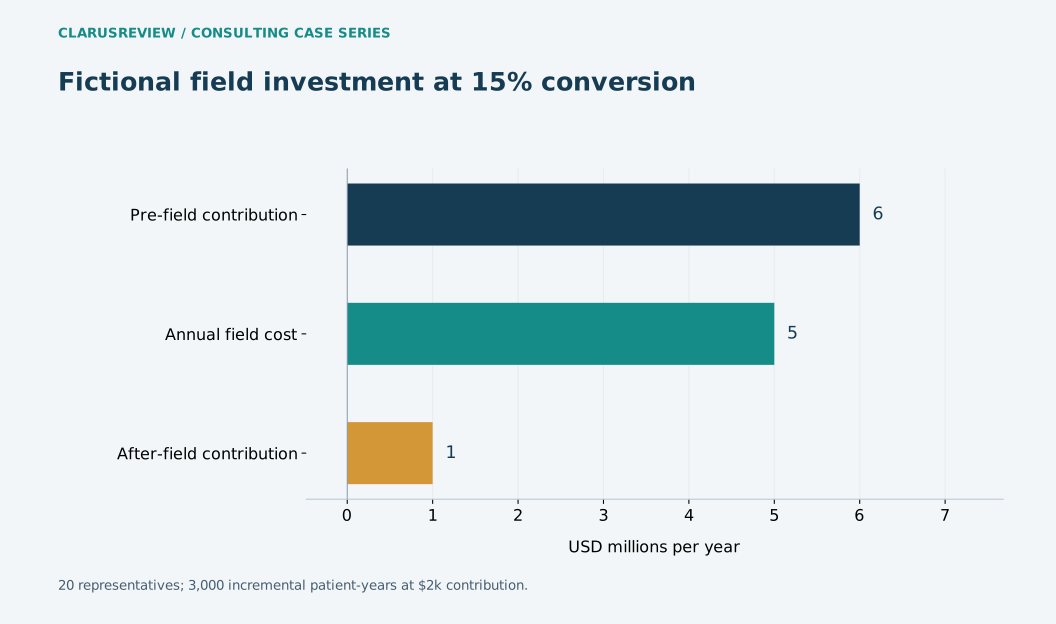
View figure data and context
| Measure | Value |
|---|---|
| Pre-field contribution | 6 |
| Annual field cost | 5 |
| After-field contribution | 1 |
The consulting assignment
A mature brand can demonstrate substantial commercial success and still become the wrong destination for the next field dollar. When competition changes its contribution, leadership needs an operating comparison between maintaining coverage and supporting the next product. The consultant’s work should connect reachable prescribers, conversion, persistence and net contribution rather than treating sales-force size as the strategy.
The documented comparator
Novartis reported approximately $7.8 billion in Entresto sales for 2024. Its Q2 2026 report disclosed $1.181 billion in quarterly Entresto sales, down 50% in U.S.-dollar terms year over year, with generic competition affecting performance. Annual and quarterly values have different periods and should not be plotted as consecutive comparable observations. [1,2]
The current-news bridge
The current reporting creates a lifecycle-planning question: how should a fictional company redeploy scarce launch resources as a mature product loses economics? It does not disclose Novartis’s internal sales-force choices or establish the result of any proposed redeployment.
Hypothetical client and numerical assumptions
Assume the fictional company reallocates 20 representatives, each costing $250,000 fully loaded annually, to a new specialty product. Annual cost is $5 million. If each representative reaches 100 distinct appropriate prescribers and incremental conversion is 15%, there are 300 incremental active prescribers. At ten incremental patient-years per prescriber, the model yields 3,000 patient-years.
What the numbers change
At an assumed $2,000 contribution per incremental patient-year before field cost, the model produces $6 million contribution and $1 million after field cost. Conversion of 10% yields $4 million and a $1 million deficit; 20% yields $8 million and a $3 million surplus. These are fictional sensitivities, not Entresto margins or an endorsement of prescribing targets.
Distinct prescriber reach must be deduplicated across representatives and channels. Ten patient-years per prescriber also needs evidence about clinical appropriateness, initiation and persistence; it cannot be inferred from call frequency. The model should count only incrementality relative to a comparison strategy, not every prescription in a contacted territory.
Leaving the legacy brand also has opportunity cost. Estimate the contribution that would be lost under reduced coverage and include transition cost, medical-support obligations and training. The new-product case is incomplete if it adds launch benefit while assuming no consequence for the old portfolio. A phased redeployment can preserve learning and reduce irreversible commitments.
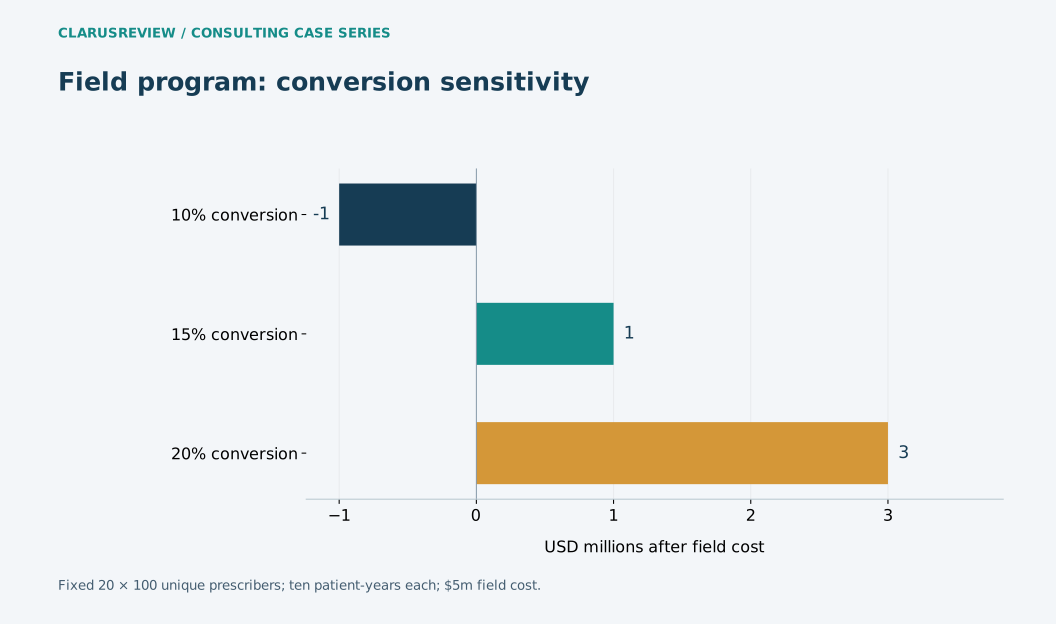
| Scenario | USD millions after field cost |
|---|---|
| 10% conversion | -1 |
| 15% conversion | 1 |
| 20% conversion | 3 |
The next decision gate
Pilot in matched territories for a defined period, with compliance-approved education and clinically appropriate use as constraints. Review incremental contribution, prescriber overlap and patient continuation before enlarging the team. Reassign resources when the next milestone is demonstrably funded and supported, not merely when the old brand’s headline declines.
What to watch next
Expected portfolio challenge: growth assets and declining brands will compete for the same operating capacity. Revisit the allocation quarterly using common contribution definitions and dated assumptions.
| Workstream | Measure to collect | Decision use |
|---|---|---|
| Reach | Unique clinically relevant prescribers reached | Deduplicate territories and channels |
| Conversion | Incremental active prescribers versus comparator | Separate attributed activity from causal incrementality |
| Economics | Contribution after field and legacy opportunity cost | Allocate resources on a consistent basis |
Reporting cutoff: October 1, 2026 Pacific. Later outcomes are not assumed. These tools illustrate decisions; they are not validated clinical, legal or investment prediction models.
Specialty-field contribution planner
Fixed assumptions: 100 unique prescribers per representative, ten incremental patient-years per converted prescriber, $250k annual rep cost.
Contribution = reps × 100 × conversion / 100 × ten patient-years × unit contribution − reps × $250,000.
Changing an input explores a scenario; it does not establish an observed result. Inputs stay in this page and are not submitted.
THE NEXT VALUE INFLECTION
What would change the decision
Pilot in matched territories for a defined period, with compliance-approved education and clinically appropriate use as constraints. Review incremental contribution, prescriber overlap and patient continuation before enlarging the team. Reassign resources when the next milestone is demonstrably funded and supported, not merely when the old brand’s headline declines.
Editorial record
Prepared by Clarus Biotech Review editorial team. Updated 10/2/2026.
Publication relationship: ClarusReview is connected to BioClarus Consulting. No article-specific sponsorship is recorded.
Report a correctionDiscuss this paper
Share evidence, ask a question, or offer a professional perspective. Community guidelines
Loading discussion…