What is a second manufacturing source actually worth?
Genzyme’s remediation history anchors a hypothetical outage-exposure and backup-capacity decision.
ClarusBIOTECH REVIEWRead, listen & keep
Narrated by Hermione. Save the audio for offline listening.
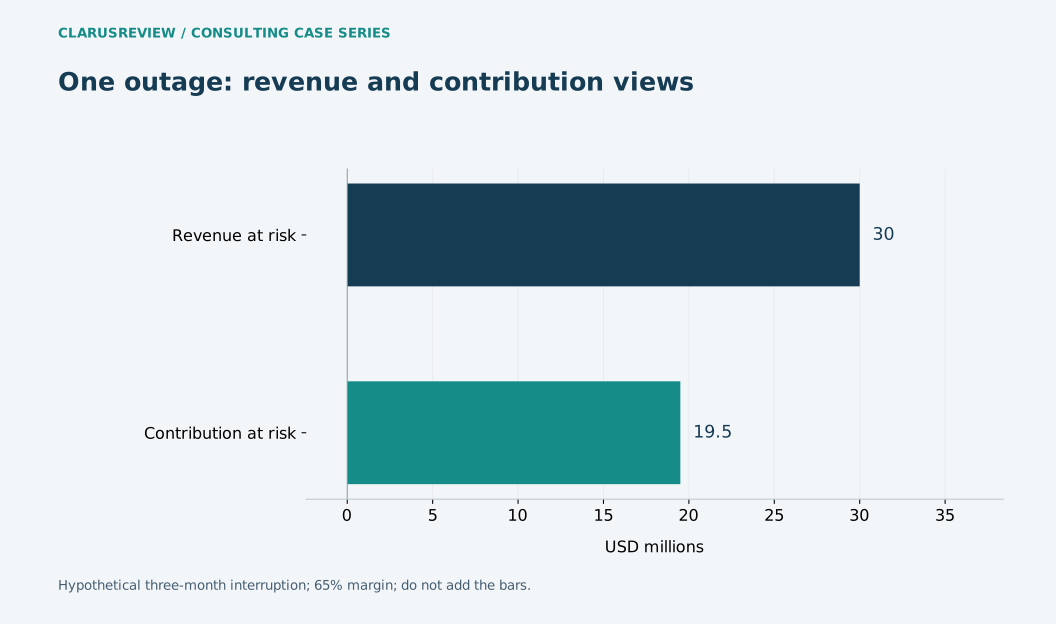
View figure data and context
| Measure | Value |
|---|---|
| Revenue at risk | 30 |
| Contribution at risk | 19.5 |
The consulting assignment
Manufacturing resilience is often defended with an alarming historical example and a large proposed capital project. A more useful assignment estimates which outage risks the investment can actually reduce, how long qualified backup capacity takes to become available and which exposures remain. A second facility is not a second source until the relevant process and product can be supplied reliably.
The documented comparator
Genzyme’s May 2010 consent-decree announcement described $175 million in disgorgement of past profits and remediation of manufacturing operations. The historical amount measures one consequence of that case; it is not a universal penalty estimate or the complete cost of supply interruption. [1]
The current-news bridge
FDA’s January 2026 cell/gene therapy CMC framework puts manufacturing strategy back in current development planning. A flexible development approach still needs a credible supply and quality plan. [2]
Hypothetical client and numerical assumptions
The fictional client supplies a biologic with $120 million annual net revenue. Assume a three-month outage puts $30 million of sales at risk before inventory protection. At 65% contribution margin, that is $19.5 million of contribution exposure. Lost revenue and lost contribution should not be added together; they are alternative financial views.
What the numbers change
A proposed qualified backup costs an assumed $6 million annually and reduces the at-risk outage duration from three months to one. Under the same margin assumption, contribution exposure falls from $19.5 million to $6.5 million: a $13 million reduction conditional on that outage occurring. Expected annual avoided exposure is the reduction multiplied by the assumed annual outage probability.
At outage probabilities of 10%, 25% and 50%, modeled avoided contribution is $1.3 million, $3.25 million and $6.5 million. Only the highest of these covers the $6 million annual backup cost on this simplified financial basis. The break-even probability is about 46.2%. These probabilities are invented sensitivity inputs, not estimated failure rates for Genzyme or another manufacturer.
The financial model omits patient harm, supply obligations, reputational effects, qualification spending and correlated failures. Those omissions can materially change the decision. Two facilities sharing the same constrained raw material or analytical method may not provide independent protection. Inventory can bridge a short outage but brings expiry and working-capital costs that require a separate model.
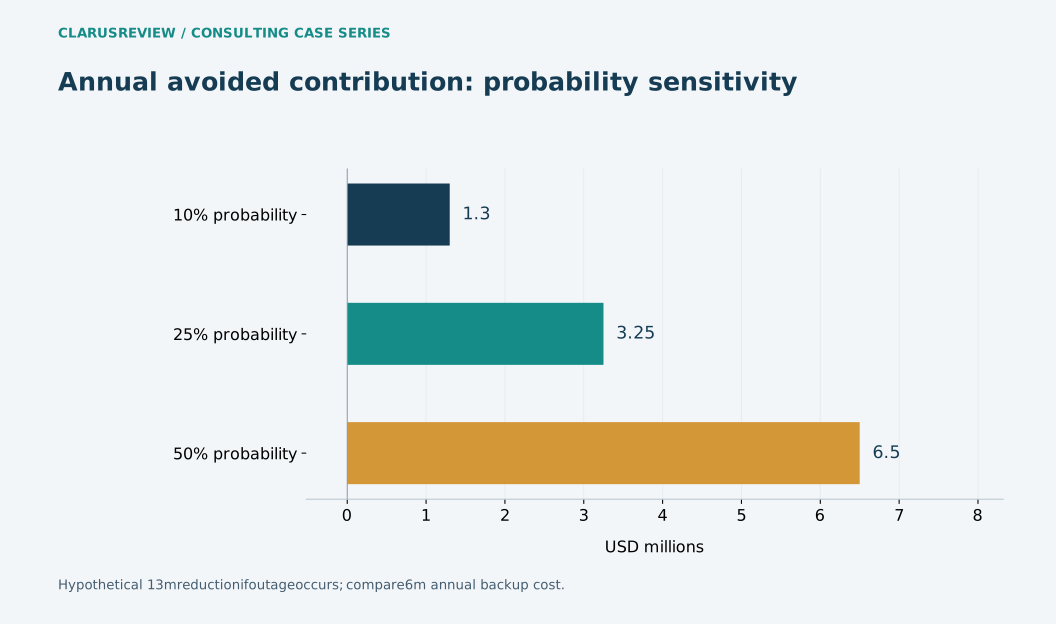
| Scenario | USD millions |
|---|---|
| 10% probability | 1.3 |
| 25% probability | 3.25 |
| 50% probability | 6.5 |
The next decision gate
Request a product-specific failure-mode map and backup qualification schedule before approving the annual cost. Quantify shared dependencies and test the assumption that two months of exposure can be avoided. Choose staged qualification or targeted redundancy if it retires the principal risk sooner; document nonfinancial obligations rather than burying them in an invented probability.
What to watch next
Watch capacity qualification, supplier concentration and release-testing bottlenecks as the program scales. The article’s break-even result is a sensitivity screen, not a claim that resilience is unnecessary below a particular probability.
| Workstream | Measure to collect | Decision use |
|---|---|---|
| Supply | Days of qualified coverage by failure mode | Test whether redundancy addresses the actual bottleneck |
| Quality | Release success and time by qualified source | Separate nominal capacity from usable supply |
| Finance | Conditional versus probability-weighted exposure | Avoid presenting a worst case as an expected loss |
Reporting cutoff: October 1, 2026 Pacific. Later outcomes are not assumed. These tools illustrate decisions; they are not validated clinical, legal or investment prediction models.
Backup-capacity financial screen
Compare annual avoided contribution with an assumed $6m annual backup cost; the model excludes patient and contractual consequences.
Avoided contribution = annual revenue × margin × two avoided months / 12 × outage probability.
Changing an input explores a scenario; it does not establish an observed result. Inputs stay in this page and are not submitted.
THE NEXT VALUE INFLECTION
What would change the decision
Request a product-specific failure-mode map and backup qualification schedule before approving the annual cost. Quantify shared dependencies and test the assumption that two months of exposure can be avoided. Choose staged qualification or targeted redundancy if it retires the principal risk sooner; document nonfinancial obligations rather than burying them in an invented probability.
Editorial record
Prepared by Clarus Biotech Review editorial team. Updated 10/2/2026.
Publication relationship: ClarusReview is connected to BioClarus Consulting. No article-specific sponsorship is recorded.
Report a correctionDiscuss this paper
Share evidence, ask a question, or offer a professional perspective. Community guidelines
Loading discussion…