From HER2 to ESR1: the diagnostic can set the launch clock
A drug–diagnostic operating model turns assay availability, testing attrition and turnaround into measurable launch dependencies.
ClarusBIOTECH REVIEWRead, listen & keep
Narrated by Hermione. Save the audio for offline listening.
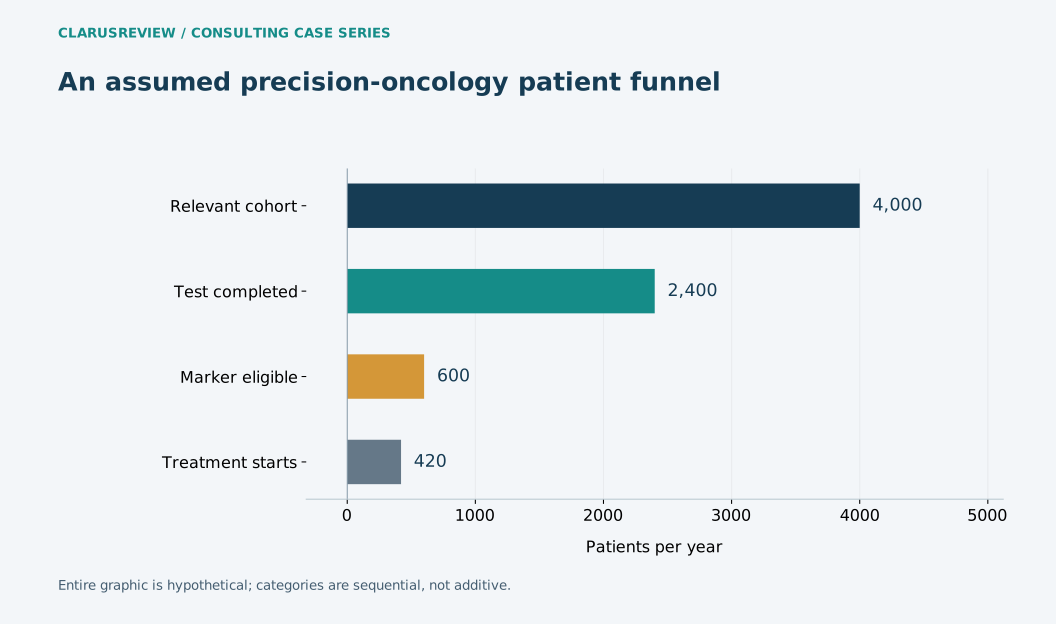
View figure data and context
| Measure | Value |
|---|---|
| Relevant cohort | 4,000 |
| Test completed | 2,400 |
| Marker eligible | 600 |
| Treatment starts | 420 |
The consulting assignment
A precision-medicine launch begins earlier than the first prescription. It begins when a clinician recognizes whom to test, obtains a usable specimen, receives an interpretable result and acts within the treatment window. That chain belongs in the target product profile and the launch budget. Otherwise the commercial forecast counts biologically eligible patients who never become operationally reachable.
The documented comparator
Herceptin’s original FDA approval was dated September 25, 1998 and specified HER2-overexpressing metastatic breast cancer populations. The historical case links treatment selection to evidence about tumor biology. It does not establish the prevalence, test performance or treatment conversion for today’s unrelated molecular programs. [1]
The current-news bridge
FDA’s September 4, 2026 camizestrant announcement also authorized Guardant360 CDx for ESR1 mutation identification. The more recent example makes serial testing during treatment a concrete workflow question rather than a generic precision-oncology slogan. [2]
Hypothetical client and numerical assumptions
Consider an invented launch region with 4,000 clinically relevant patients annually. Assume 60% receive testing, 25% of tested patients meet the modeled biomarker criterion and 70% of those initiate the hypothetical therapy. This yields 420 starts: 4,000 × 0.60 × 0.25 × 0.70. The assumptions describe a fictional product; they are not HER2 or ESR1 epidemiology.
What the numbers change
Improving test completion from 60% to 75%, with other assumptions fixed, raises starts to 525. That is 105 additional starts, not evidence that promotional activity caused them. A campaign may increase test orders while specimen rejection or delayed interpretation still suppresses completed care. The dashboard must follow completed tests and subsequent decisions, not only awareness.
Assume the intervention costs $300,000 and each additional completed start contributes $5,000 after product-variable costs. The modeled $525,000 contribution less intervention cost leaves $225,000 before fixed overhead. This is an explicit decision sensitivity, not a product margin claim. If only 40 additional starts materialize, contribution is $200,000 and the intervention does not recover its assumed cost.
Diagnostic partners need accountability for invalid results, turnaround, result delivery and clinician training. A study assay and a commercially deployable assay can impose different service dependencies. Even a technically strong test becomes weak infrastructure if nobody owns the handoff from laboratory to prescriber.
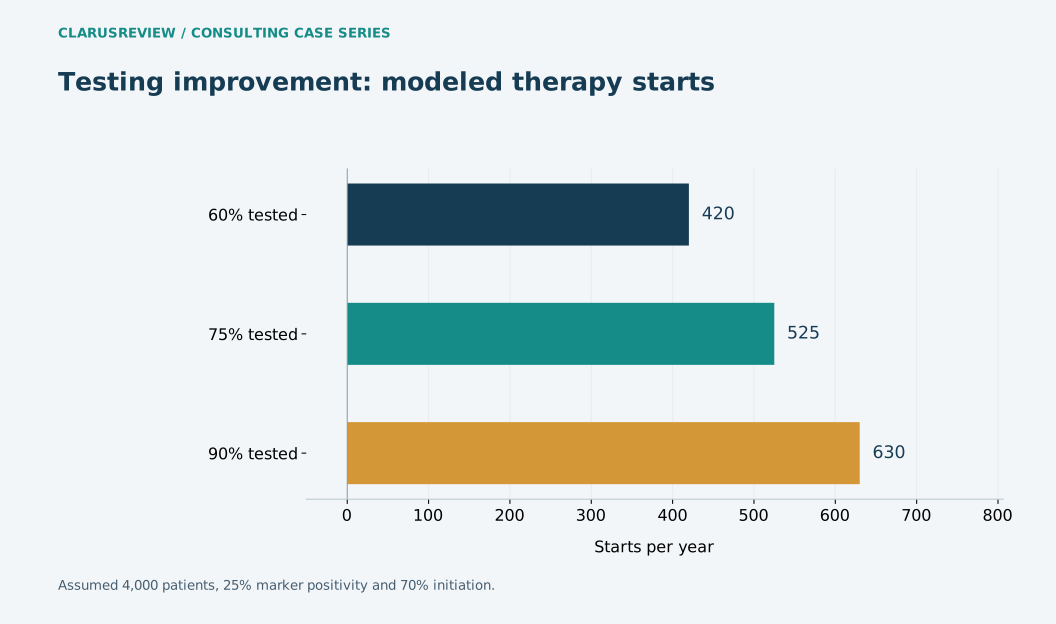
| Scenario | Starts per year |
|---|---|
| 60% tested | 420 |
| 75% tested | 525 |
| 90% tested | 630 |
The next decision gate
Use a 90-day pilot to audit every transition: order, sample, valid result, eligible finding, clinical decision and start. Compare similar sites and preserve rejected specimens in the denominator. Scale the program only when the incremental contribution case survives realistic conversion and service costs; biomarker-specific clinical use remains governed by the applicable authorization.
What to watch next
Expected issue to monitor: the economic value of repeated molecular testing depends on when results can change management. Track missed decision windows rather than assuming every repeat assay adds value.
| Workstream | Measure to collect | Decision use |
|---|---|---|
| Testing | Valid completed tests / relevant cohort | Distinguish orders from usable results |
| Timing | Results returned before decision / tests | Find losses that shorten the treatment window |
| Adoption | Starts / marker-eligible patients | Audit handoffs and access constraints |
Reporting cutoff: October 1, 2026 Pacific. Later outcomes are not assumed. These tools illustrate decisions; they are not validated clinical, legal or investment prediction models.
Diagnostic-to-start conversion
Hold marker positivity at the fictional 25% used in the article; change the other funnel inputs.
Starts = cohort × tested / 100 × 25% × initiation / 100.
Changing an input explores a scenario; it does not establish an observed result. Inputs stay in this page and are not submitted.
THE NEXT VALUE INFLECTION
What would change the decision
Use a 90-day pilot to audit every transition: order, sample, valid result, eligible finding, clinical decision and start. Compare similar sites and preserve rejected specimens in the denominator. Scale the program only when the incremental contribution case survives realistic conversion and service costs; biomarker-specific clinical use remains governed by the applicable authorization.
Editorial record
Prepared by Clarus Biotech Review editorial team. Updated 10/2/2026.
Publication relationship: ClarusReview is connected to BioClarus Consulting. No article-specific sponsorship is recorded.
Report a correctionDiscuss this paper
Share evidence, ask a question, or offer a professional perspective. Community guidelines
Loading discussion…