Imatinib’s targeting lesson: fund the evidence bridge before the pivotal leap
IRIS and a recent biomarker-led approval frame a hypothetical oncology program’s recruitment, assay and capital decisions.
ClarusBIOTECH REVIEWRead, listen & keep
Narrated by Hermione. Save the audio for offline listening.
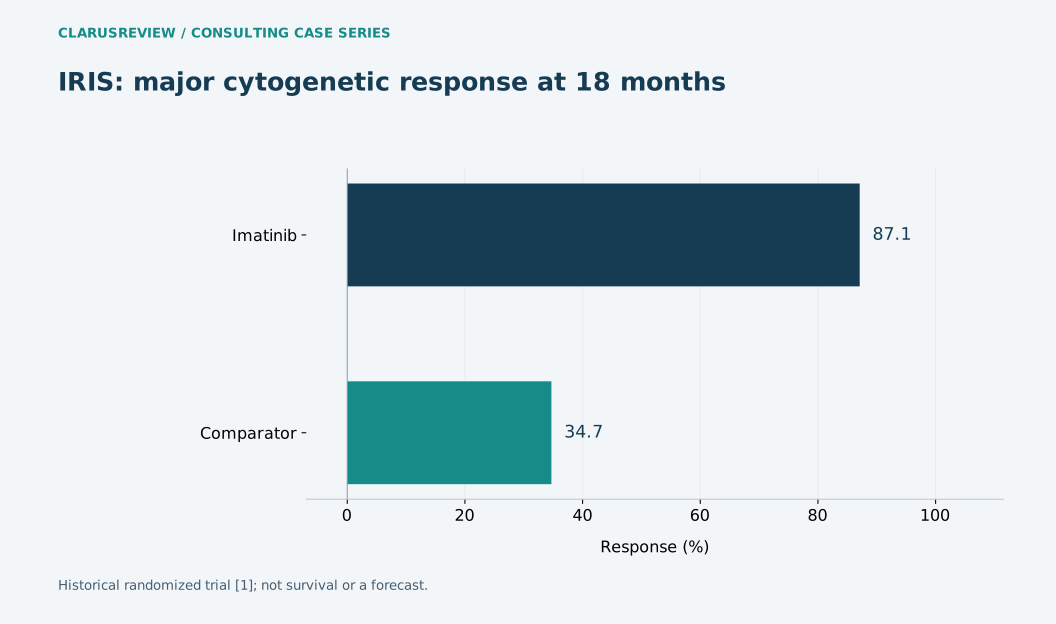
View figure data and context
| Measure | Value |
|---|---|
| Imatinib | 87.1 |
| Comparator | 34.7 |
The consulting assignment
A target can be biologically persuasive while the development plan remains commercially fragile. The consultant’s task is to identify the shortest credible bridge from mechanism to a patient-defined result, then expose every dependency that can prevent the bridge from being completed. Imatinib is a useful historical comparator because the clinical claim was anchored to a defined disease and an explicit randomized comparison.
The documented comparator
IRIS randomized 1,106 patients with newly diagnosed chronic-phase CML. Estimated major cytogenetic response at 18 months was 87.1% with imatinib and 34.7% with interferon alfa plus cytarabine: a calculated 52.4-percentage-point difference. That is a cytogenetic endpoint, not an overall-survival estimate or a success probability for another target. [1]
The current-news bridge
September 2026’s FDA authorization of camizestrant paired treatment eligibility with ESR1 mutation testing. It provides a current reason to plan the assay and the drug together, although its disease and treatment setting differ from IRIS. [2]
Hypothetical client and numerical assumptions
Assume an unrelated Phase II oncology sponsor plans 120 evaluable patients. Its modeled biomarker prevalence is 15%, and 80% of biomarker-positive screened patients are expected to remain eligible and complete evaluable follow-up. These are invented planning assumptions. The resulting screening requirement is 120 ÷ (0.15 × 0.80) = 1,000 people, before any rounding or additional operational losses.
What the numbers change
At $2,000 per screened patient, the assumed screening line is $2 million. If prevalence is 10% rather than 15%, the same requirement becomes 1,500 screens and $3 million. A 20% prevalence assumption produces 750 screens and $1.5 million. Those dollars exclude treatment, sites, monitoring and assay-development spending.
Twenty sites each screening five patients monthly would need ten months for 1,000 screens, assuming simultaneous activation and a steady flow. Site ramp-up and geographic referral limits make that a lower-complexity planning estimate rather than a promised recruitment date. A development plan that quotes only 120 enrolled patients hides both the screening burden and its funding dependency.
The target dossier should connect causal biology, exposure, target engagement, clinical endpoint and assay reproducibility. Genetic association or a laboratory response can prioritize work; neither eliminates the need to demonstrate interpretable patient outcomes. Enrollment feasibility deserves the same diligence as pharmacology because an under-recruited trial cannot retire the intended uncertainty.
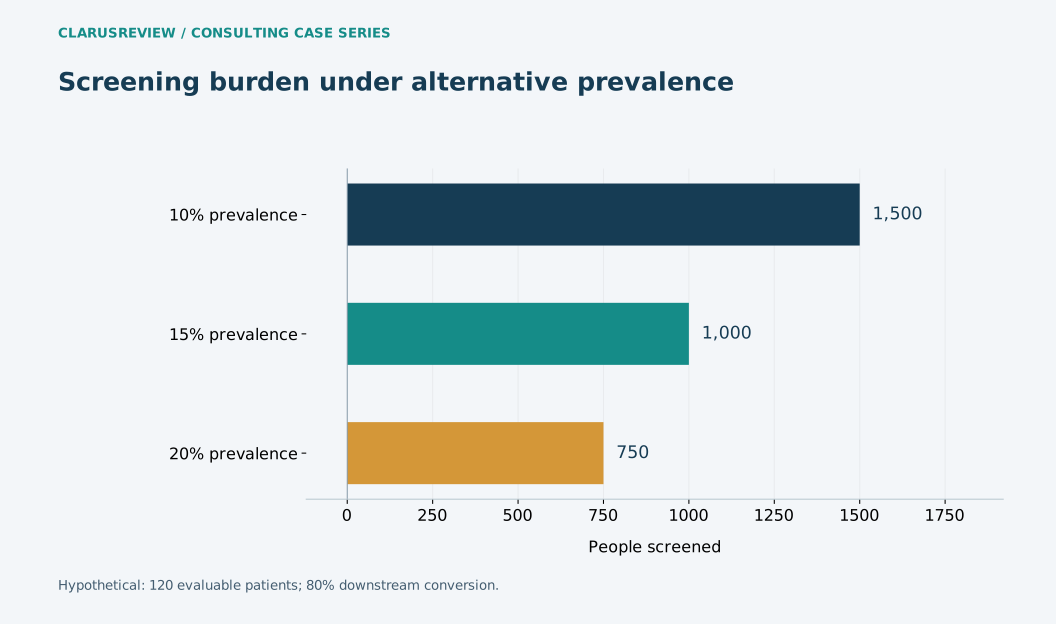
| Scenario | People screened |
|---|---|
| 10% prevalence | 1500 |
| 15% prevalence | 1000 |
| 20% prevalence | 750 |
The next decision gate
Before releasing a pivotal-study budget, require a prospective screening pilot, locked assay procedures and a recruitment model reconciled to observed referral flow. The proposed operating gate is at least 100 pilot screens with missing results and eligibility losses disclosed; it is a client assumption, not a regulatory standard. Use the pilot to revise prevalence and monthly screening capacity rather than changing the endpoint to rescue the original schedule.
What to watch next
Forward scenario: molecularly selected oncology programs may expand the importance of diagnostic logistics. Watch assay turnaround, mutation prevalence by line of therapy and screen-to-evaluable conversion; no additional approval is presumed.
| Workstream | Measure to collect | Decision use |
|---|---|---|
| Assay execution | Median sample-to-result days; invalid / tested | Detect a diagnostic bottleneck before trial expansion |
| Recruitment | Evaluable / all screened, by site and month | Reforecast time and spending |
| Capital | Screening spend / evaluable patient | Separate patient selection from treatment cost |
Reporting cutoff: October 1, 2026 Pacific. Later outcomes are not assumed. These tools illustrate decisions; they are not validated clinical, legal or investment prediction models.
Biomarker recruitment calculator
Estimate screening demand; this is not a clinical sample-size or statistical-power calculator.
Screens = target / (prevalence / 100 × conversion / 100).
Changing an input explores a scenario; it does not establish an observed result. Inputs stay in this page and are not submitted.
THE NEXT VALUE INFLECTION
What would change the decision
Before releasing a pivotal-study budget, require a prospective screening pilot, locked assay procedures and a recruitment model reconciled to observed referral flow. The proposed operating gate is at least 100 pilot screens with missing results and eligibility losses disclosed; it is a client assumption, not a regulatory standard. Use the pilot to revise prevalence and monthly screening capacity rather than changing the endpoint to rescue the original schedule.
Editorial record
Prepared by Clarus Biotech Review editorial team. Updated 10/2/2026.
Publication relationship: ClarusReview is connected to BioClarus Consulting. No article-specific sponsorship is recorded.
Report a correctionDiscuss this paper
Share evidence, ask a question, or offer a professional perspective. Community guidelines
Loading discussion…