The CAR-T slot is a promise across two organizations
Kymriah and current cell-therapy commercialization frame manufacturing reliability, release timing and patient readiness.
ClarusBIOTECH REVIEWRead, listen & keep
Narrated by Hermione. Save the audio for offline listening.
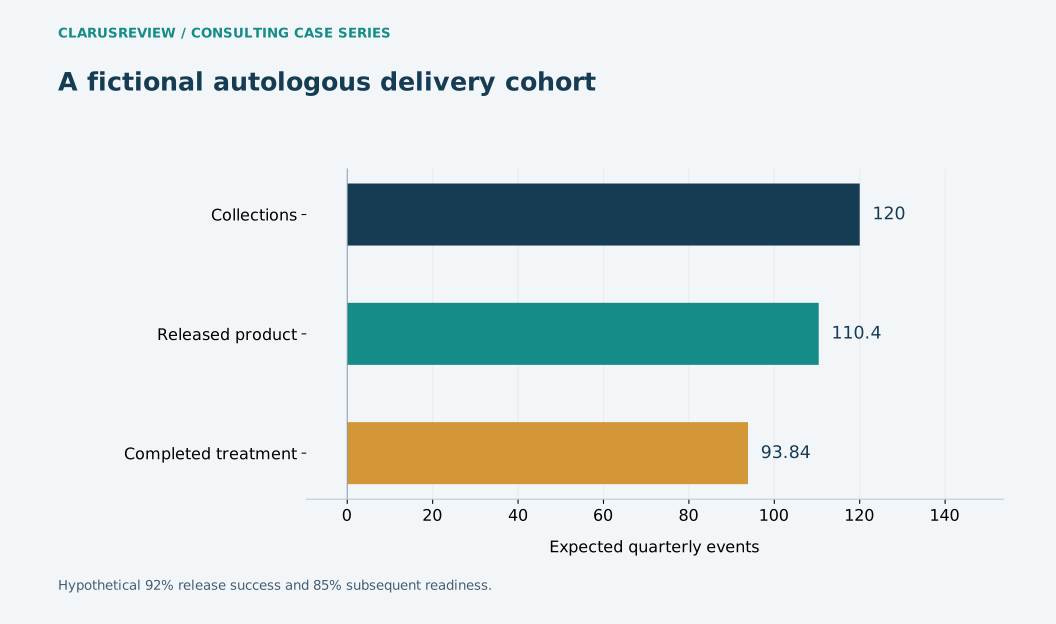
View figure data and context
| Measure | Value |
|---|---|
| Collections | 120 |
| Released product | 110.4 |
| Completed treatment | 93.84 |
The consulting assignment
Autologous cell therapy links a patient-specific manufacturing process to a clinical service that cannot simply consume inventory on demand. Every handoff carries identity, timing and readiness requirements. A consulting assignment should follow the unit of service from collection to completed administration; a successful batch alone is an incomplete operating outcome.
The documented comparator
Kymriah’s original FDA approval occurred on August 30, 2017. The case is a historical anchor for analyzing individualized cell-therapy delivery, not a source for assuming today’s batch-failure rate, manufacturing turnaround or price. Those variables must be supplied by the program being evaluated. [1]
The current-news bridge
Vertex’s Q2 2026 results provide a recent commercial checkpoint for a different patient-specific genetic therapy. The comparison concerns coordinated delivery; it does not equate CAR-T oncology outcomes with sickle-cell gene editing. [2]
Hypothetical client and numerical assumptions
Assume a fictional CAR-T network begins 120 collections each quarter. Manufacturing produces an acceptable product for 92%, and 85% of those patients remain ready at the scheduled administration point. Expected completions are 120 × 0.92 × 0.85 = 93.84. The two rates are invented and represent distinct failure opportunities.
What the numbers change
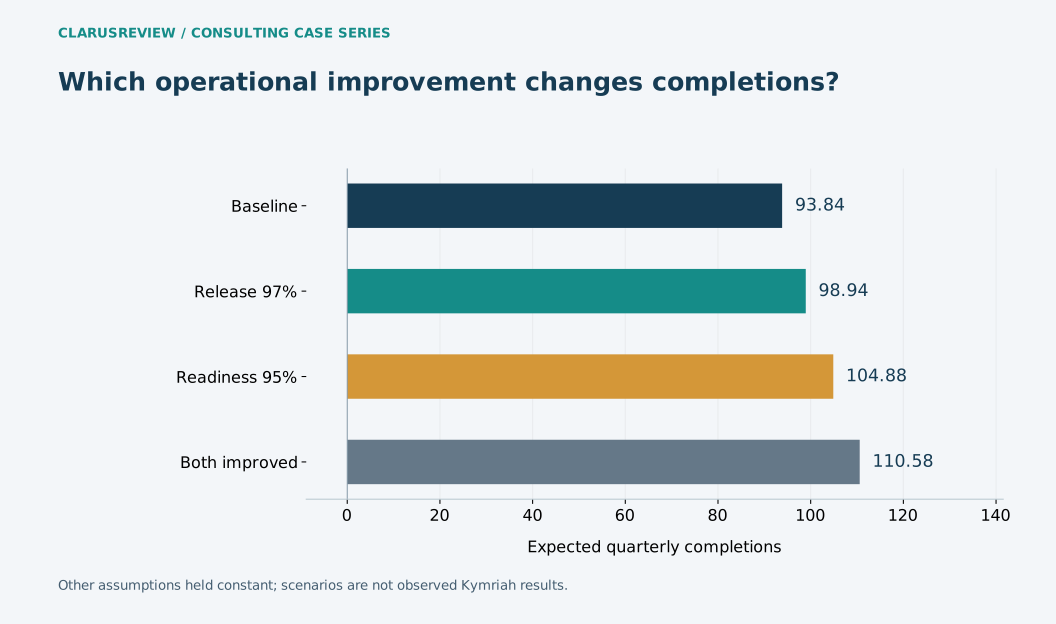
Raising release success to 97%, with readiness unchanged, produces 98.94 completions. Raising readiness to 95%, with release success unchanged, produces 104.88. Improving both gives 110.58. The comparison reveals why the clinical coordination team can be as important as the manufacturing team; it does not imply that all readiness losses are preventable.
At an assumed $80,000 manufacturing cost per collection, quarterly manufacturing spend is $9.6 million, or about $102,302 per expected completion in the baseline. This allocated ratio includes spend on unsuccessful attempts but excludes care costs and overhead. If costs are incurred at different stages, a more detailed activity-based model is needed.
Turnaround should be decomposed into transit, queue, processing, testing, release and clinical scheduling. A median can conceal extreme delays that matter greatly to individual patients. Report the 90th percentile alongside the median and maintain clinical reasons for non-completion. A throughput target must never convert an unsuitable patient into a required operational output.
| Scenario | Expected quarterly completions |
|---|---|
| Baseline | 93.84 |
| Release 97% | 98.94 |
| Readiness 95% | 104.88 |
| Both improved | 110.58 |
The next decision gate
Require a joint manufacturer–center review of the next 30 consecutive collections. Reconcile timestamps and identity controls; classify non-completions without dropping them from the cohort. Select the intervention with the best documented effect on completed suitable treatment, and measure whether it introduces new errors or extra handling.
What to watch next
Forward planning should include a delayed-release contingency and a process for communicating revised dates. Do not assume later automation will eliminate testing, clinical readiness or chain-of-identity requirements.
| Workstream | Measure to collect | Decision use |
|---|---|---|
| Manufacturing | Released / collected; median and P90 turnaround | Locate quality and queue constraints |
| Clinical readiness | Completed / released with reason codes | Distinguish coordination losses from disease changes |
| Unit economics | Stage-specific spend / completed treatment | Include failed attempts explicitly |
Reporting cutoff: October 1, 2026 Pacific. Later outcomes are not assumed. These tools illustrate decisions; they are not validated clinical, legal or investment prediction models.
Collection-to-treatment model
Use conditional rates: readiness is measured among released products, not all referrals.
Completions = collections × release / 100 × readiness / 100.
Changing an input explores a scenario; it does not establish an observed result. Inputs stay in this page and are not submitted.
THE NEXT VALUE INFLECTION
What would change the decision
Require a joint manufacturer–center review of the next 30 consecutive collections. Reconcile timestamps and identity controls; classify non-completions without dropping them from the cohort. Select the intervention with the best documented effect on completed suitable treatment, and measure whether it introduces new errors or extra handling.
Editorial record
Prepared by Clarus Biotech Review editorial team. Updated 10/2/2026.
Publication relationship: ClarusReview is connected to BioClarus Consulting. No article-specific sponsorship is recorded.
Report a correctionDiscuss this paper
Share evidence, ask a question, or offer a professional perspective. Community guidelines
Loading discussion…