Drug-development economics: make the assumptions visible
A corrected public cost study shows why a headline R&D estimate is a starting point for analysis, not a universal budget or price justification.
ClarusBIOTECH REVIEWRead, listen & keep
Narrated by Hermione. Save the audio for offline listening.
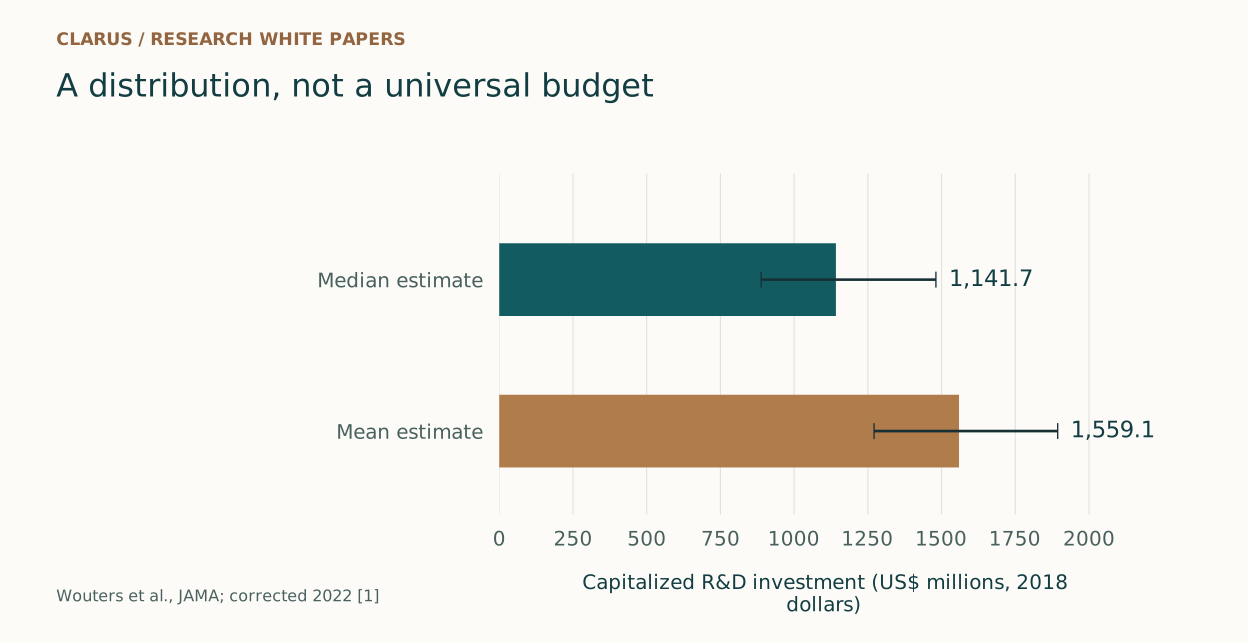
View figure data and uncertainty
| Measure | Reported value | 95% confidence interval |
|---|---|---|
| Median estimate | 1,141.7 | 888.1–1,480.8 |
| Mean estimate | 1,559.1 | 1,271–1,893.8 |
Executive perspective
A single development-cost number is attractive because it simplifies a complex economic story. It can also hide the assumptions that make the number meaningful: the sample, the treatment of failed programs, the time value of money, and the distinction between spending and capitalized investment. An access discussion is stronger when those assumptions are visible.
This white paper examines a public research estimate and proposes a practical way to use it in planning. The goal is a transparent economic model that readers can challenge, rather than a headline figure that is repeated across unrelated products.
Published evidence and revision
Wouters, McKee and Luyten’s JAMA study examined 63 agents approved in 2009–2018. The publisher’s corrected base-case estimates are a median capitalized R&D investment of US$1,141.7 million (95% CI 888.1–1,480.8) and a mean of US$1,559.1 million (1,271.0–1,893.8), expressed in 2018 dollars and incorporating failure costs with a 10.5% annual cost of capital. The article was corrected in September 2022. [1]
A separate 2022 observational study examined the association between R&D estimates and treatment costs and reported no observed correlation in its analyses. Cost estimation and pricing therefore need distinct questions and evidence rather than an assumed direct relationship. [2]
Clarus analysis: separate three economic quantities
The first quantity is direct and indirect program spending. It is the resource outlay relevant to an operating budget. The second is portfolio-adjusted development investment, which depends on how unsuccessful programs are allocated to successful outcomes. The third is capitalized investment, which adds a time-value assumption. These quantities can differ substantially while describing the same development activity.
A program budget should start from its own work plan: studies, manufacturing development, quality activity, personnel, and operational dependencies. A published benchmark can test whether the proposed envelope deserves closer examination. It cannot substitute for the work plan or determine what the team must spend next.
An access model needs another set of inputs. It should describe the intended population, comparator, outcome, delivery conditions, and whose costs or benefits are being counted. A development investment estimate does not establish affordability, cost effectiveness, or the price a purchaser should accept.
The corrected study also demonstrates an editorial principle. Keep the source version and correction history attached to a figure. A statistic copied from an older abstract or secondary summary can remain in circulation after the authoritative article changes. Traceability matters most when the number is likely to be reused in a strategic or commercial narrative.
A practical economic model review
Use a assumptions register with an owner and a source for every material input. Show the operating budget separately from modeled portfolio failure allocation and capitalization. Run sensitivity analyses on the inputs that could change the decision, and describe their ranges as assumptions rather than measured facts.
When communicating the result, label the currency year and explain whether a figure is a mean, a median, or a scenario. The decision packet should reveal which assumptions dominate the result and what additional evidence would narrow them. This makes disagreement productive: reviewers can change an input and see the implication instead of debating an unexplained total.
Limits and next evidence
The study relied on publicly accessible data for a selected subset of agents and is not representative of every sponsor or program. The chart uses corrected historical estimates, not inflation-adjusted 2026 budgets. Program financing, pricing, and access decisions require product-specific evidence and assumptions.
From reading to a reviewable decision
| Dimension | Evidence to inspect | Next decision check |
|---|---|---|
| Operating budget | Program-specific resource outlay | Build from the work plan |
| Investment model | Failure allocation and capitalization | Expose the sensitive assumptions |
| Access model | Comparator, outcomes, costs, population | Evaluate the actual purchaser question |
Clarus editorial synthesis. This framework is not a validated predictive model.
THE NEXT VALUE INFLECTION
What would change the decision
The study relied on publicly accessible data for a selected subset of agents and is not representative of every sponsor or program. The chart uses corrected historical estimates, not inflation-adjusted 2026 budgets. Program financing, pricing, and access decisions require product-specific evidence and assumptions.
Editorial record
Prepared by Clarus Biotech Review editorial team. Updated 9/30/2026.
Publication relationship: ClarusReview is connected to BioClarus Consulting. No article-specific sponsorship is recorded.
Report a correctionDiscuss this paper
Share evidence, ask a question, or offer a professional perspective. Community guidelines
Loading discussion…