Rare disease: the comparator, the patient pathway and the capital milestone
Why a small, well-defined population still needs rigorous comparison, diagnostic execution and a clear financing plan.
ClarusBIOTECH REVIEWRead, listen & keep
Narrated by Hermione. Save the audio for offline listening.

Rare-disease development makes the connection between evidence and execution unusually visible. A molecular diagnosis can sharpen a therapeutic hypothesis, but it does not guarantee an interpretable endpoint, timely recruitment or accessible treatment. The BioClarus source paper considers cystic fibrosis, hemophilia, spinal muscular atrophy, Duchenne muscular dystrophy and paroxysmal nocturnal hemoglobinuria. This adaptation adds an ATTR polyneuropathy case to examine a question that travels across these settings: what does the comparator allow the reader to conclude?
A small population does not make comparator choice secondary
FDA approved Wainua (eplontersen) on December 21, 2023. The original-approval snapshot describes 144 treated patients across 52 sites in 16 countries. The primary efficacy comparison used an external placebo group from an earlier study. At week 35, the efficacy analysis showed least-squares mean mNIS+7 changes of 0.2 versus 9.2 points; the adjusted difference was −9.0 (95% CI −13.5 to −4.5). Lower scores indicate less impairment. The efficacy populations were 140 and 59, respectively; these denominators differ from the treated safety population. [1]
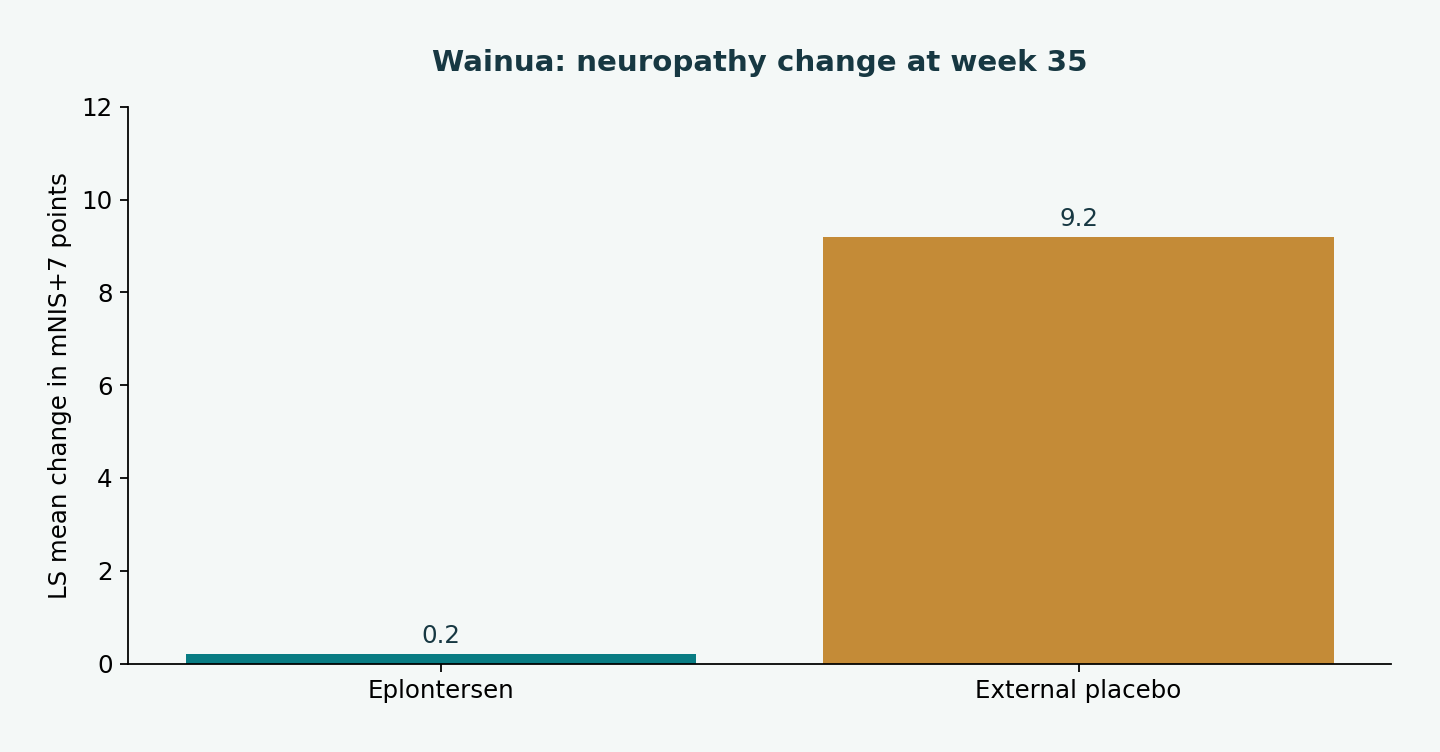
An external comparator can be informative, but differences in enrollment period, supportive care, disease severity and outcome assessment need scrutiny. The strategic lesson is to design comparability before the readout. A sponsor should specify eligibility matching, outcome collection, missing-data handling and sensitivity analyses before favorable results become the organizing narrative. The comparison should always remain visible in investor and payer materials.
Financing terms reveal a sequence of evidence obligations
The December 2021 Ionis–AstraZeneca agreement announcement described $200 million upfront, up to $485 million in development and approval milestones, and up to $2.9 billion in sales-related milestones. These were announced contractual categories, not a statement that every milestone had been earned. [2]
The structure illustrates why an enterprise-value milestone is not synonymous with a single clinical endpoint. Clinical and regulatory evidence can unlock one form of payment; commercialization at scale can unlock another. A board should keep cash already available separate from contingent proceeds when estimating runway. A sales milestone cannot finance a study today unless another financing mechanism bridges the interval.
Build the addressable population from the patient pathway
The source paper’s genotype and disease-stage lens is more useful than a broad rare-disease market total. Start with the population in scope, then track confirmed diagnoses, eligibility, specialist access, reimbursement and treatment initiation. A prevalence estimate does not directly measure any of those downstream groups. For genetic therapies, eligibility may also depend on prior treatment, antibodies, organ function or ability to complete associated procedures.
Consider a hypothetical service plan with 1,000 identified patients: 60% complete confirmatory work-up, 70% of those meet product eligibility, 80% of those obtain coverage and 90% of those initiate treatment. Sequential multiplication produces about 302 starts, not 1,000. These percentages are planning assumptions, not epidemiologic estimates or observed conversion rates. This simple model helps identify which missing data would most improve a commercial forecast.
At an assumed $2,000 per completed diagnostic work-up, the 600 work-ups alone would cost $1.2 million. That is a program-planning illustration, not a reimbursement rate, patient bill or product price. Different parties may bear the costs, and access improvements should be evaluated against patient burden as well as company revenue.
Five markets, different evidence priorities
In cystic fibrosis, define genotype coverage and residual unmet need relative to available care. In hemophilia, distinguish bleed prevention, treatment burden and durability. In SMA and DMD, age, baseline function and natural history can materially change interpretation of functional outcomes. In PNH, separate hematologic response, transfusion burden and patient-reported fatigue rather than collapsing them into one success label. These are diligence questions drawn from the source framework, not a current product ranking.
For every program, choose the next decision before choosing the presentation. A useful evidence gate has a threshold, a responsible owner and a consequence for falling short. Registry completion, diagnostic yield and continuity of treatment should have explicit denominators and time windows. The result is a program that can explain who benefits, how that conclusion was reached, and what operational work remains before benefit becomes accessible.
Proposed executive dashboard
| Decision area | Measure or question | Why it matters |
|---|---|---|
| Comparator | Baseline balance; missingness; sensitivity to historical-control selection | Shows whether interpretation depends on untested comparability |
| Diagnosis | Confirmed diagnoses / completed work-ups; days to confirmation | Defines a measurable access bottleneck |
| Clinical follow-up | Assessments completed / due at the specified week | Makes attrition visible |
| Finance | Unrestricted cash / monthly net burn; milestones separately probability-weighted | Prevents contingent economics from becoming assumed runway |
| Access | Initiations / eligible covered patients; discontinuation by reason | Connects evidence to sustained use |
THE NEXT VALUE INFLECTION
What would change the decision
For every program, choose the next decision before choosing the presentation. A useful evidence gate has a threshold, a responsible owner and a consequence for falling short. Registry completion, diagnostic yield and continuity of treatment should have explicit denominators and time windows. The result is a program that can explain who benefits, how that conclusion was reached, and what operational work remains before benefit becomes accessible.
Editorial record
Prepared by Clarus Biotech Review editorial team. Updated 10/1/2026.
Publication relationship: ClarusReview is connected to BioClarus Consulting. No article-specific sponsorship is recorded.
Report a correctionDiscuss this paper
Share evidence, ask a question, or offer a professional perspective. Community guidelines
Loading discussion…