The biotech value curve: define what changes at each evidence gate
A numerical framework for understanding why a milestone may change value—and why the calendar alone does not.
ClarusBIOTECH REVIEWRead, listen & keep
Narrated by Hermione. Save the audio for offline listening.

The value-curve source paper describes enterprise value as potentially changing when evidence removes a specific uncertainty. Value-Inflection Engineering turns that observation into a work plan: identify the decision, define the evidence required and organize the resources needed before stakeholders can reasonably change their assessment.
A milestone can create options, but it can also close them. A positive result may require a costly pivotal program; a negative result may identify a narrower use or justify stopping. The useful curve therefore has branches, costs and decision criteria. A smooth upward illustration should never be interpreted as a promised valuation trajectory.
A simple numerical bridge exposes the assumptions
Consider an illustrative asset with $300 million of conditional future value, a 10% working probability and $20 million of remaining cost. The simplified undiscounted expected net value is $10 million: 0.10 × $300 million − $20 million. If supportive evidence raises the working probability to 25% while the next program raises remaining cost to $40 million, the same model gives $35 million. Neither probability is an industry benchmark or a prediction for a named asset.
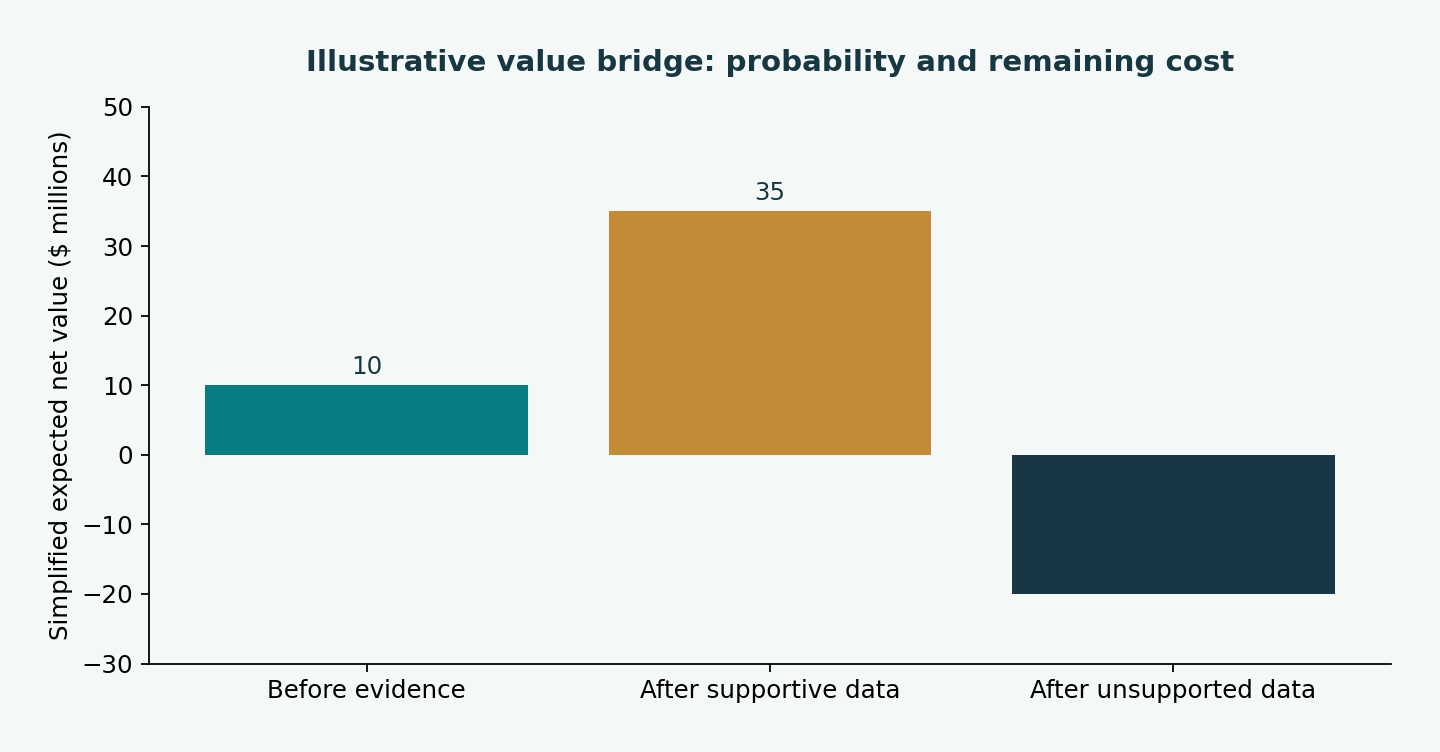
If evidence does not support advancement, assigning zero probability while retaining $20 million of planned cost produces negative $20 million. That branch signals that stopping or redesigning may preserve capital. A real decision model should consider salvage options, alternative indications, IP, rights, taxes, financing and discounting. The simplified arithmetic is useful because it makes the evidence-to-assumption link explicit; it is not a company valuation method on its own.
The timing assumption also matters. At a hypothetical 15% discount rate, $75 million of probability-weighted proceeds two years away has a present value of about $56.71 million. Three years away it is about $49.31 million. The difference is roughly $7.40 million before changing costs or risk. This is a timing sensitivity under the same assumptions, not the value of a specific trial delay.
A label expansion is a setting-specific milestone
FDA’s December 15, 2025 approval of Enhertu with pertuzumab concerned first-line unresectable or metastatic HER2-positive breast cancer. DESTINY-Breast09 enrolled 1,157 adults across three arms. The reported median PFS was 40.7 months with the combination versus 26.9 months with taxane, trastuzumab and pertuzumab; HR 0.56 (95% CI 0.44–0.71). The calculated 13.8-month difference between medians is not an overall-survival gain or a per-patient guarantee. [1]
This example illustrates how an evidence milestone can change the treatment setting a product addresses. It does not establish a financial return attributable to the readout. The commercial analysis still needs eligibility, diagnostic practice, competing treatments, supply, access and the economics of the specific regimen. Scientific progress and financial repricing are connected through those assumptions rather than an automatic multiplier.
Design the gate before the result
At a preclinical gate, specify the translational hypothesis and the evidence required to enter humans. At an early clinical gate, specify exposure, safety, dose logic and the limits of the signal. At proof of concept, define the population, comparator, effect threshold and uncertainty needed for the next study. Before a pivotal commitment, ask whether the program can support both the regulatory question and the evidence needed for practical adoption.
Threshold, target and upside scenarios should have different consequences. Meeting a minimum threshold may justify a narrower plan; meeting the target may justify a larger study; an upside result may permit several paths. A missed threshold should not be relabeled after the fact solely to preserve a narrative. Where redesign is reasonable, document the new hypothesis and evidence needed.
Build the operating package around the gate
The source paper proposes an integrated package covering clinical development, regulation, access, finance and stakeholder communication. Translate that into owned deliverables: a target product profile, evidence-gap map, resource model, decision memo and dated risk register. Keep the factual core consistent across investor, partner, clinical and payer materials.
A milestone review should state what changed, what did not change and which assumptions need new data. A result may improve biological confidence while leaving manufacturing or adoption risk untouched. If those remaining constraints cap the next decision, the organization should direct resources there instead of assuming that another scientific experiment will resolve them.
The value curve becomes operational when each step has a measurable evidentiary purpose, an affordable next action and a credible stopping rule. That is the distinction between a development calendar and an executable inflection plan.
| Decision area | Measure or question | Why it matters |
|---|---|---|
| Evidence gate | Threshold, target and upside defined prospectively | Avoids changing success criteria after the readout |
| Valuation assumption | Probability, timing and conditional value with sensitivity | Makes repricing logic visible |
| Capital | Remaining cost and funding buffer by branch | Connects a positive result to a financeable next step |
| Adoption | Eligible population, diagnostics and access requirements | Tests whether the clinical opportunity is practical |
| Governance | Owner, date, continue/narrow/stop decision | Turns the curve into an operating process |
THE NEXT VALUE INFLECTION
What would change the decision
The value curve becomes operational when each step has a measurable evidentiary purpose, an affordable next action and a credible stopping rule. That is the distinction between a development calendar and an executable inflection plan.
Editorial record
Prepared by Clarus Biotech Review editorial team. Updated 10/1/2026.
Publication relationship: ClarusReview is connected to BioClarus Consulting. No article-specific sponsorship is recorded.
Report a correctionDiscuss this paper
Share evidence, ask a question, or offer a professional perspective. Community guidelines
Loading discussion…